Note of lesson7 : Deep Learning Part 1 of Spring 2020 at USF
Today we will study
- Collaborative Filtering
- Tabular modelling
CONTENTS
- Collaborative Filtering
- Tabular modelling
Collaborative Filtering
Collaborative filtering from scratch
Last time issue: We are overfitting with just small batch</br> Capacity of model, normally reducing the parameter of model ends up very shallow model
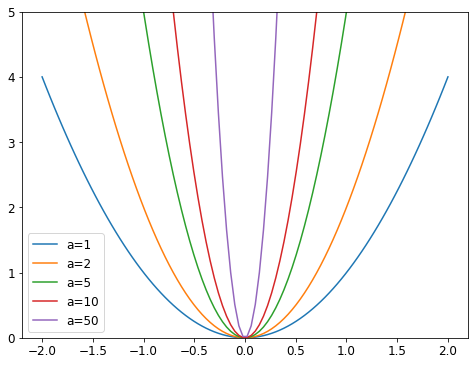
Weight decay
a= 50 means just small change will give you big results.
(#f)
weight decay means adding some valud to the gradients, so that it makes more shallow and less bumpy loss.
Be cautious, when you do statistical model, they lessen the parameter to evade overfitting but modern machine learning doesn’t do that, and add regularization
Creating our own Embedding module
Embedding is just indexing into an array
Normally layer is made from inhertancing of module
when you call torch and make tensor, they doesn’t have parameter, and you should define it using nn.parameter
def create_params(size):
    return nn.Parameter(torch.zeros(*size).normal_(0, 0.01))

class DotProductBias(Module):
    def __init__(self, n_users, n_movies, n_factors, y_range=(0,5.5)):
        self.user_factors = create_params([n_users, n_factors])
        self.user_bias = create_params([n_users])
        self.movie_factors = create_params([n_movies, n_factors])
        self.movie_bias = create_params([n_movies])
        self.y_range = y_range

    def forward(self, x):
        users = self.user_factors[x[:,0]]
        movies = self.movie_factors[x[:,1]]
        res = (users*movies).sum(dim=1)
        res += self.user_bias[x[:,0]] + self.movie_bias[x[:,1]]
        return sigmoid_range(res, *self.y_range)
pytorch has autograd so that we don’t have to calculate gradient manually
What’s our advantage making our own embedding instead of using pytorch one J: no advantage just implementing by yourself and easily learn concept.
Interpreting embeddings and biases
movie_bias = learn.model.movie_bias.squeeze()
idxs = movie_bias.argsort()[:5]
[dls.classes['title'][i] for i in idxs]
meaning of this, not just (#f)
we can use pca, and filter factors to 3, so we can select some kind of latent factors. 1
Using fastai.collab
learn = collab_learner(dls, n_factors=50, y_range=(0, 5.5))
learn.fit_one_cycle(5, 5e-3, wd=0.1)
you can get similar results using fastai
Embedding distance
Distance between two movies.
Let’s pick some movie and find distance, form one movie to every other movies.
(#f)
(#f) J: visualization part is just what’s going in and..? sound quality is not good
Boot strapping a collaborative filtering
Deep Learning for collaborative filtering
the other way to do collab, we can concatenate the embeddings
(#q) can’t understand
get_emb_sz method, fast.ai will give you the layer’s tensor size
learn = collab_learner(dls, use_nn=True, y_range=(0, 5.5), layers=[100,50])
learn.fit_one_cycle(5, 5e-3, wd=0.1)
if you use params use_nn=True, you can use concat version of collab
Sidebar: kwargs and delegates
End sidebar
Conclusion
Questionnaire
Tabular modelling
Categorical embeddings
It’s been a not much time that tabular data is used for deep learning model.
Ex) German regions in embedding, if we draw embedding of the german city, it resembles actual german map
many kinds of information of the world can be represented using embedding
This is how google’s recommendation system works.
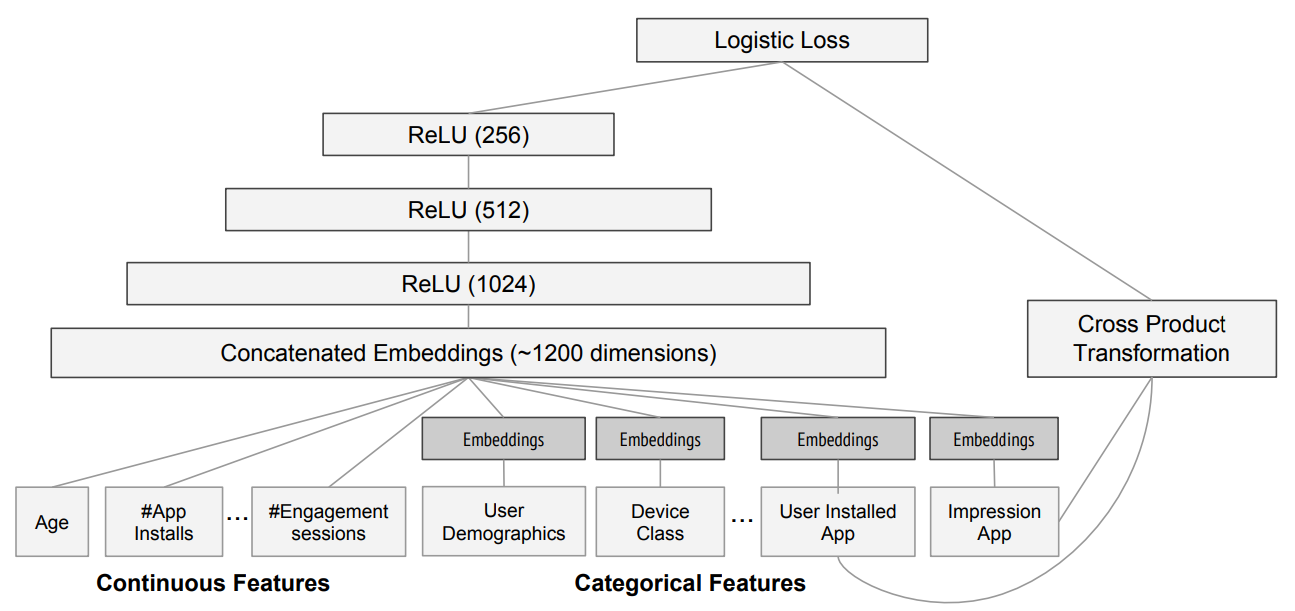
They use collab, which is concatenation of embeddingsgoogoo
Beyond Deep Learning
sometimes the other model, which is not deep learning models(classical model) do better than modern deep learning model
- Ensembles of decision trees (i.e. Random Forests and Gradient Boosting Machines), mainly for structured data (such as you might find in a database table at most companies)
- Multi-layered neural networks learnt with SGD (i.e. shallow and/or deep learning), mainly for unstructured data (such as audio, vision, and natural language)
try 1 first, and after that try 2.
How the decision tree ensenble works?
we usually scikit-learn library.
Refer this book
when you use y_range maximum as 5.5? J: because it uses sigmoid, which can’t reach to the max, min value 2
Do you recommend real-time service using decision-tree? for my own experience it was too slow. J:
The dataset
kaggle Competitions
Look at the data
At this point, a good next step is to handle ordinal columns and in this case, it is size of the product. we can make it as a categorical variables
Jeremy read this part, this it when I do review
Decision trees
It doesn’t require you special coding skill
This is some good example of feature engineering
Handling dates
Using TabularPandas and TabularProc
TabularProc - Tabular process, which is in-place function.
Categorify - make column with a numeric value, which is same with we saw at vocab.
And we should think about valiation, and at this case, making test set as random is not enough. because this is basically related to time.
See how test set is divided, and we can set the validation set as future time data.
Creating the decision tree
DecisionTree Regressor, something when we want to predict continuous variable.
Data augmentation for tabular data, do you have idea? J: Not sure, but will think about data semantics unordered, and ordered category, does fast.ai distinguish between these? J: yes
you can use fastai function when drawing decision tree.
draw_tree(m, xs, size=7, leaves_parallel=True, precision=2)
look at diagram from top to bottom. it’s the best way.
basic way to do regression is predict the average.
leaf-node: not further trees when it is False
if you want to train further, we can choice leaf-note number bigger
m_rmse(m, xs, y)
> 0.0
means we made perfect model, but when we check validation model, it’s bigger than 0 - one reason is related to leaf-node
So we made our leaf-note to 25, and our result
do random tree (#f) ??
Categorical variables
related to categorical variables, we don’t have to do one-hot encode like using neural net! (we can make it, but there is no evidence it’s better)
What can I do with categorical missing value? J: (#f)
Random forests
(#q could not understand much)
: “Bagging predictors is a method for generating multiple versions of a predictor and using these to get an aggregated predictor. The aggregation averages over the versions… The multiple versions are formed by making bootstrap replicates of the learning set and using these as new learning sets. Tests… show that bagging can give substantial gains in accuracy. The vital element is the instability of the prediction method. If perturbing the learning set can cause significant changes in the predictor constructed, then bagging can improve accuracy.”
random subset, when you average the error, it is zero???
Also randomly choose the subset of columns
Creating a random forest
def rf(xs, y, n_estimators=40, max_samples=200_000,
       max_features=0.5, min_samples_leaf=5, **kwargs):
    return RandomForestRegressor(n_jobs=-1, n_estimators=n_estimators,
        max_samples=max_samples, max_features=max_features,
        min_samples_leaf=min_samples_leaf, oob_score=True).fit(xs, y)
in general, when you increase the n_estimators, the accuracy enhances more
plt.plot([r_mse(preds[:i+1].mean(0), valid_y) for i in range(40)]);
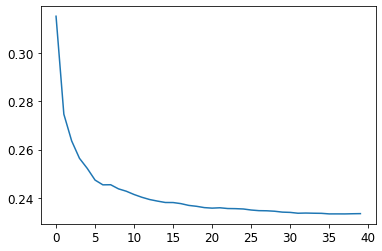
we can set up our own methods, to see what’s going on. you just picked first element of the result, and show them.
but our evaluation get low. why?
Out-of-bag error
it’s not about time set, we don’t need validation set to do it.
Model interpretation
Tree variance for prediction confidence
How confident are we in our predictions using a particular row of data?
- look at the standard deviation of the tree, how much did the tree were varied, and if we were very varied, it means we didn’t confident that much
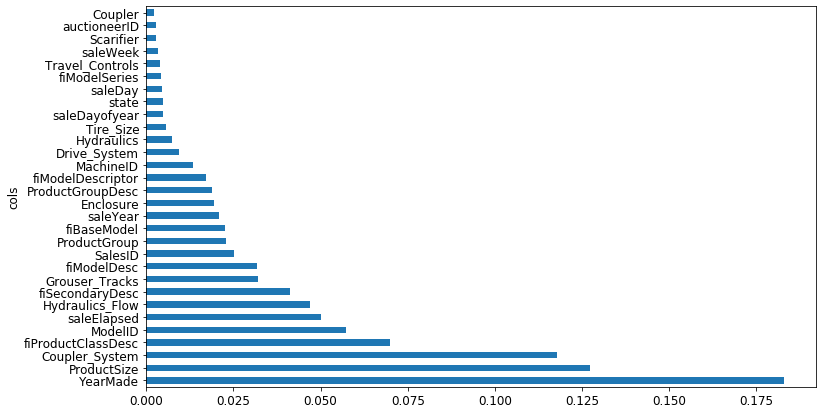
Feature importance
For predicting with a particular row of data, what were the most important factors, and how did they influence that prediction?
m.feature_importanceattribute
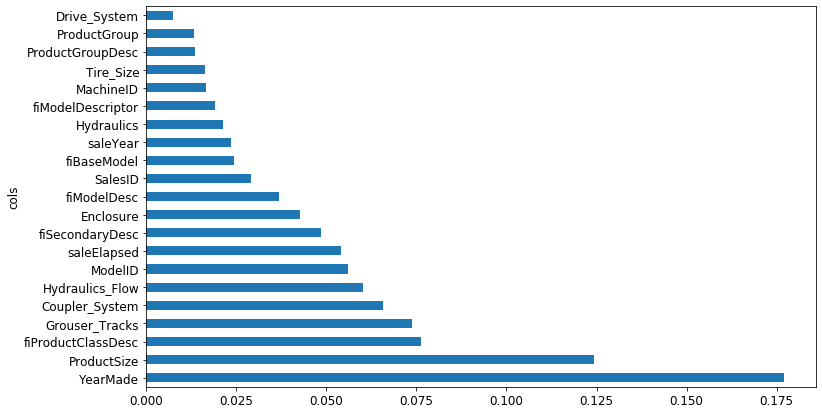
Removing low-importance variables
Which columns are the strongest predictors, which can we ignore?
remove the ignorable tree, and re train, accuracy is about to same, but the number of feature decreased. after
before we had this much features
It decreased!
Removing redundant features
Which columns are effectively redundant with each other, for purposes of prediction? How do predictions vary, as we vary these columns?
in this way we can get simpler and simpler model, remaining the accuracy
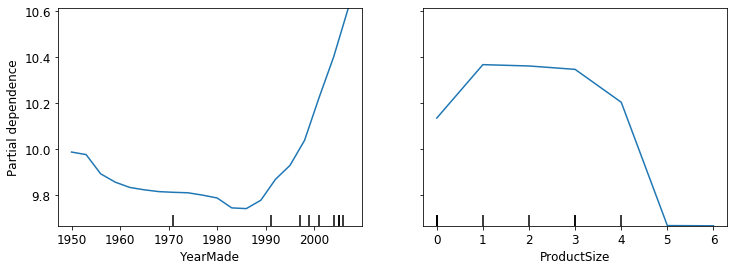
Partical dependence
best way is to draw histogram.
we can draw depends on each label, and see parti
what is said, how YearMade impact sales, if all other valud is equal?
What might be impact just mitigate specific variable?
is cluster doing something related to hierarchical J: yes
How to the feature importance values related to correlation? J: if you used to linear regression (#f) / Larry D. Here is an answer from Fra Pochetti: If 2 features are highly correlated their relative feature importance would be reduced compared to keeping just one of the two. Here why. A random forest selects features randomly at each split (in general). If 2 variables are correlated, they more or less carry the same signal wrt the dependent variable. Hence you can expect a tree to split on either of the 2 evenly. As an end result, your 2 features will have much less importance, just because they are carrying the same information. They hide each other. I generally remove correlated features even if it is not strictly needed, just to be able to uncover these kind of hidden relationships and spot truly important variables.
Data leakage
Tree interpreter
treeinterpreter module
So we take that one row of data, and put it through the first decision tree, looking to see what split is used at each point throughout the tree.
prediction[0], bias[0], contributions[0].sum()
Extrapolation and neural networks
Jeremy usually index using special value ‘None’, not unsqeeze.
random forest can’t extrapolate out side of train set, what it has seen, and this is big problem
Finding out of domain data
concatenating all of the independent variable,
and ask is this data from training set or validation set?
difference between valid data and train set,
and extrapolation will not happen if it’s neural net.
Using a neural network
Sidebar: fastai’s Tabular classes
In fastai, a tabular model is simply a model which takes columns of continuous or categorical data, and predicts a category (a classification model) or a continuous value (a regression model). Categorical independent variables are passed through an embedding, and concatenated, as we saw in the neural net we used for collaborative filtering, and then continuous variables are concatenated as well.
End sidebar
Ensembling
It’s simple we can just do average.
Boosting
another approach when we do ensemble,
this is pretty sensitive to hyper-parameters
with tabular, dropping the feature is better than regularization? J: (#f) J:
Combining embeddings with other methods
Entity embedding, which is EE
Conclusion: our advice for tabular modeling
slow regarding inference time, because they have to infer at every tree
Questionnaire
Jiwon, here is an answer from Jona R on the forum: Not certain, but I think that “0” was not actually a choice that users could rate. It seemed to me like it was used as a placeholder for “no rating” in some of Jeremy’s models. That means that the lowest you would need to predict is “1”, which means that setting range 0 provides sufficient buffer.
 Part1 lesson7 | fastai 2019 course-v3